Pledge Streak Patent
A data visualization pattern that turned months of billing history into a single readable streak. Granted USPTO Patent No. 12,154,126.

This one started as a side observation during a much larger project. I was deep in research for the Benefit Delivery redesign when creators kept bringing up the same anxiety: they were mailing expensive, physical merchandise to patrons they couldn't fully trust. Not because patrons were dishonest, but because the billing system was opaque. A card declines, a patron churns involuntarily, and the creator has no way to know if that person was a loyal supporter of three years or someone whose very first payment just failed. I designed the Pledge Streak to solve that specific anxiety. It worked well enough that Patreon's legal team wanted to patent it. I drove the concept from that initial research observation through design, through usability testing, through leadership alignment, and through the patent process itself. Jennifer Pugh was my product partner throughout. The USPTO granted Patent No. US 12,154,126 B2 on November 26, 2024.
The Problem
Patreon creators at the top tier weren't just publishing digital content. They were running small merchandise operations, mailing signed prints, handmade goods, and exclusive physical items to their most loyal supporters. And they were doing it blind.
Billing on Patreon is messy by nature. Cards expire. Banks flag recurring charges. Patrons churn involuntarily all the time, fully intending to come back. The platform had no way to surface that nuance to creators. All they could see was whether a patron was currently active or not. A three-year supporter whose card just declined looked identical to someone whose very first payment had failed.
Creators were asking a reasonable question: before I drive to the post office with a $60 piece of merchandise, can I know if this person actually deserves it? The platform had no answer.
The patron relationship manager before the Pledge Streak.
The Concept
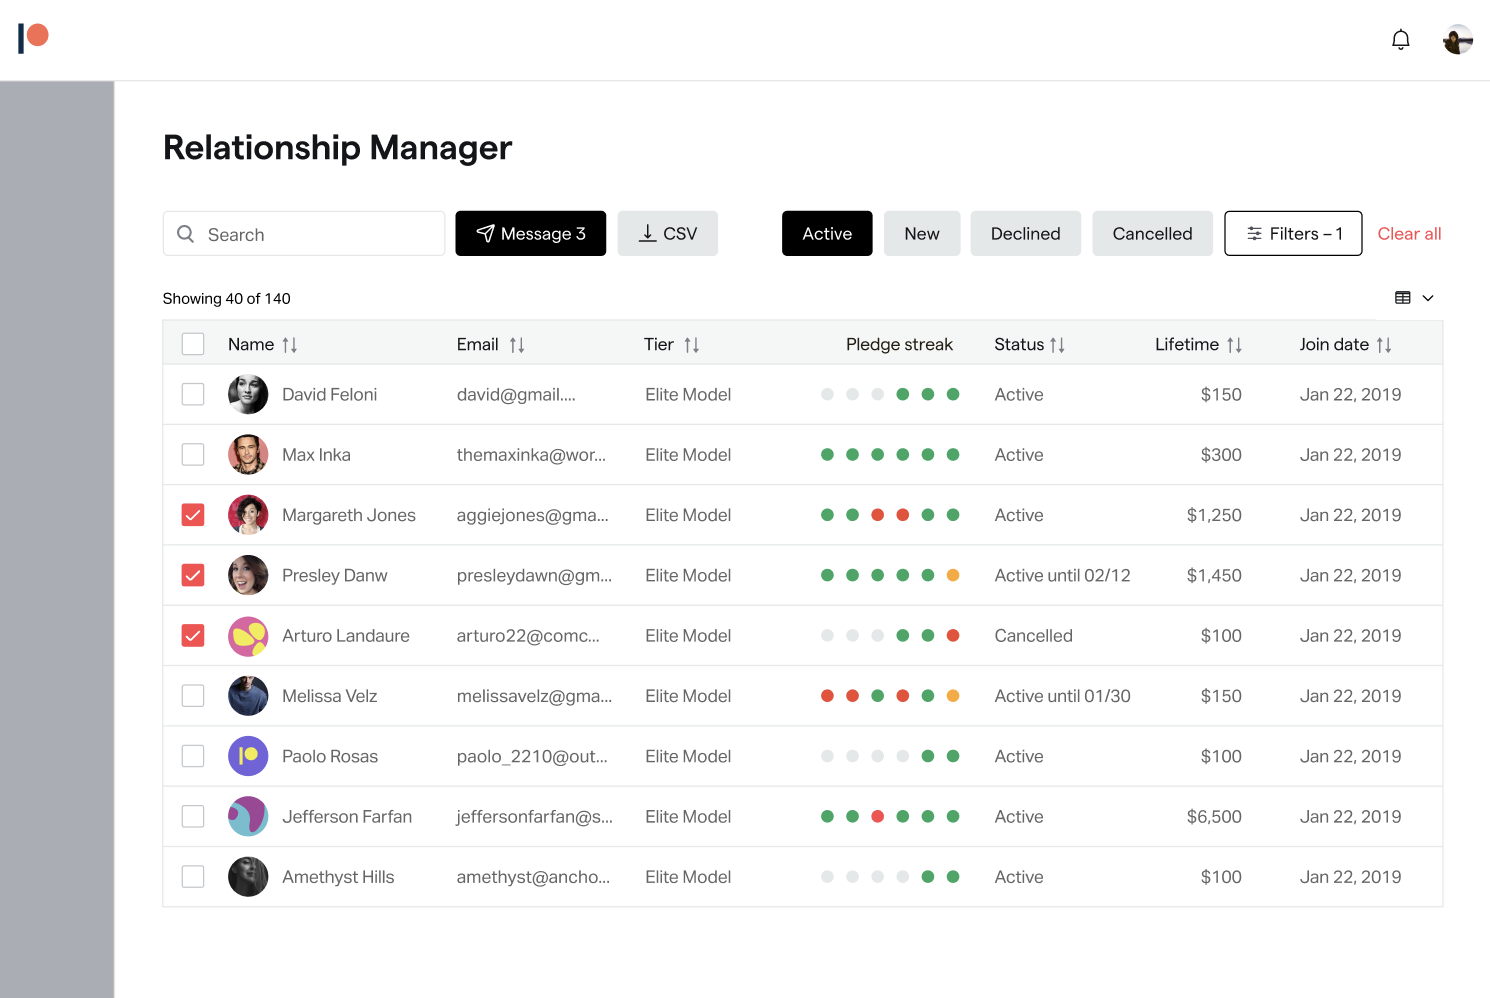
The idea was to stop hiding billing history inside a database and bring it to the surface of the patron table itself. Instead of requiring creators to click into individual profiles or export CSVs, each patron row would carry its own visual record: a short sequence of nodes, one per billing cycle, each one reflecting what actually happened that month.
A solid node for a successful payment. An outlined node for a failed or declined charge. A blank for a month when the patron wasn't subscribed. Six months at a glance, directly in the table row, right next to the patron's name.
The streak turned billing history into something readable in under a second. Creators didn't need to interpret data anymore. They could see the shape of a relationship.
The Pledge Streak integrated into the patron relationship manager.
User Research
Testing validated a critical behavioral shift: creators stopped parsing individual billing nodes and immediately began reading the overall texture of the sequence.
We tested the concept by asking creators to filter for patrons with 3+ months of tenure to award a high-value benefit. The visual streak allowed creators to spot loyal edge cases, like mock patron Jefferson Farfan, who missed the hard numerical cutoff but clearly demonstrated long-term support. This validated that visual pattern recognition was more effective than raw data filtering, laying the groundwork for the patent.
The system doesn't just display payment status per billing cycle. It models the likelihood of continued subscribership across the full history, weighting different signals differently. A cancellation workflow carries more weight than a single declined payment. A patron who upgraded their tier then had a card decline reads very differently than a patron in steady decline. The streak visualizes that probability, not just raw transaction data.
Pattern examples showing how creators read streak shapes.
Interactive Prototype
This prototype demonstrates how creators could hover over individual streak nodes to see exact billing dates and amounts, and use global filters to instantly isolate patrons with perfect streaks.
Interactive prototype of the Pledge Streak filter and tooltip. Click through to explore.
The Patent
Patreon's legal team decided the interaction model was novel enough to protect. The filing covered the full system: obtaining subscriber behavior data across billing intervals, determining weighted likelihood values using a trained machine learning model, and presenting those values as sequences of visual interface elements in an account management UI.
The patent is specific about the design layer. Color, shape, size, and indicia are all named as display characteristics. The grid layout with attribute-named columns is described.
The USPTO granted Patent No. US 12,154,126 B2 on November 26, 2024. I am listed as co-inventor alongside Jennifer Pugh, my product partner on the Patreon Creator Tools team.
A closer look at the core UI concept that was submitted for Patent No. 12,154,126.
USPTO Patent No. US 12,154,126 B2, granted November 26, 2024. Inventors: Bruno Wong and Jennifer Pugh. Assignee: Patreon Inc.
Impact & Reflection
The Pledge Streak gave creators a clear, nuanced picture of their audience's subscription behavior. It helped them deliver high-value benefits to truly qualified patrons confidently, while avoiding the unfair punishment of loyal members due to temporary bank freezes or missed payments. This ultimately protected revenue and fostered trust for everyone involved.
The thing I keep coming back to is how small the original observation was. One recurring complaint in a research session. Creators frustrated by a very specific moment: standing at a post office, unsure whether a patron had earned the thing they were about to mail.
That anxiety pointed to a real gap between what the platform knew and what it was willing to show. The design work was mostly about closing that gap as simply as possible. Six nodes in a row. The rest followed from that.
Getting a USPTO patent out of a research observation I made mid-project is something I'm genuinely proud of. Not because of the legal credential, but because it confirmed that the insight was real and that the solution was actually novel. That doesn't happen often.